USC SARS-CoV-2 Surveillance
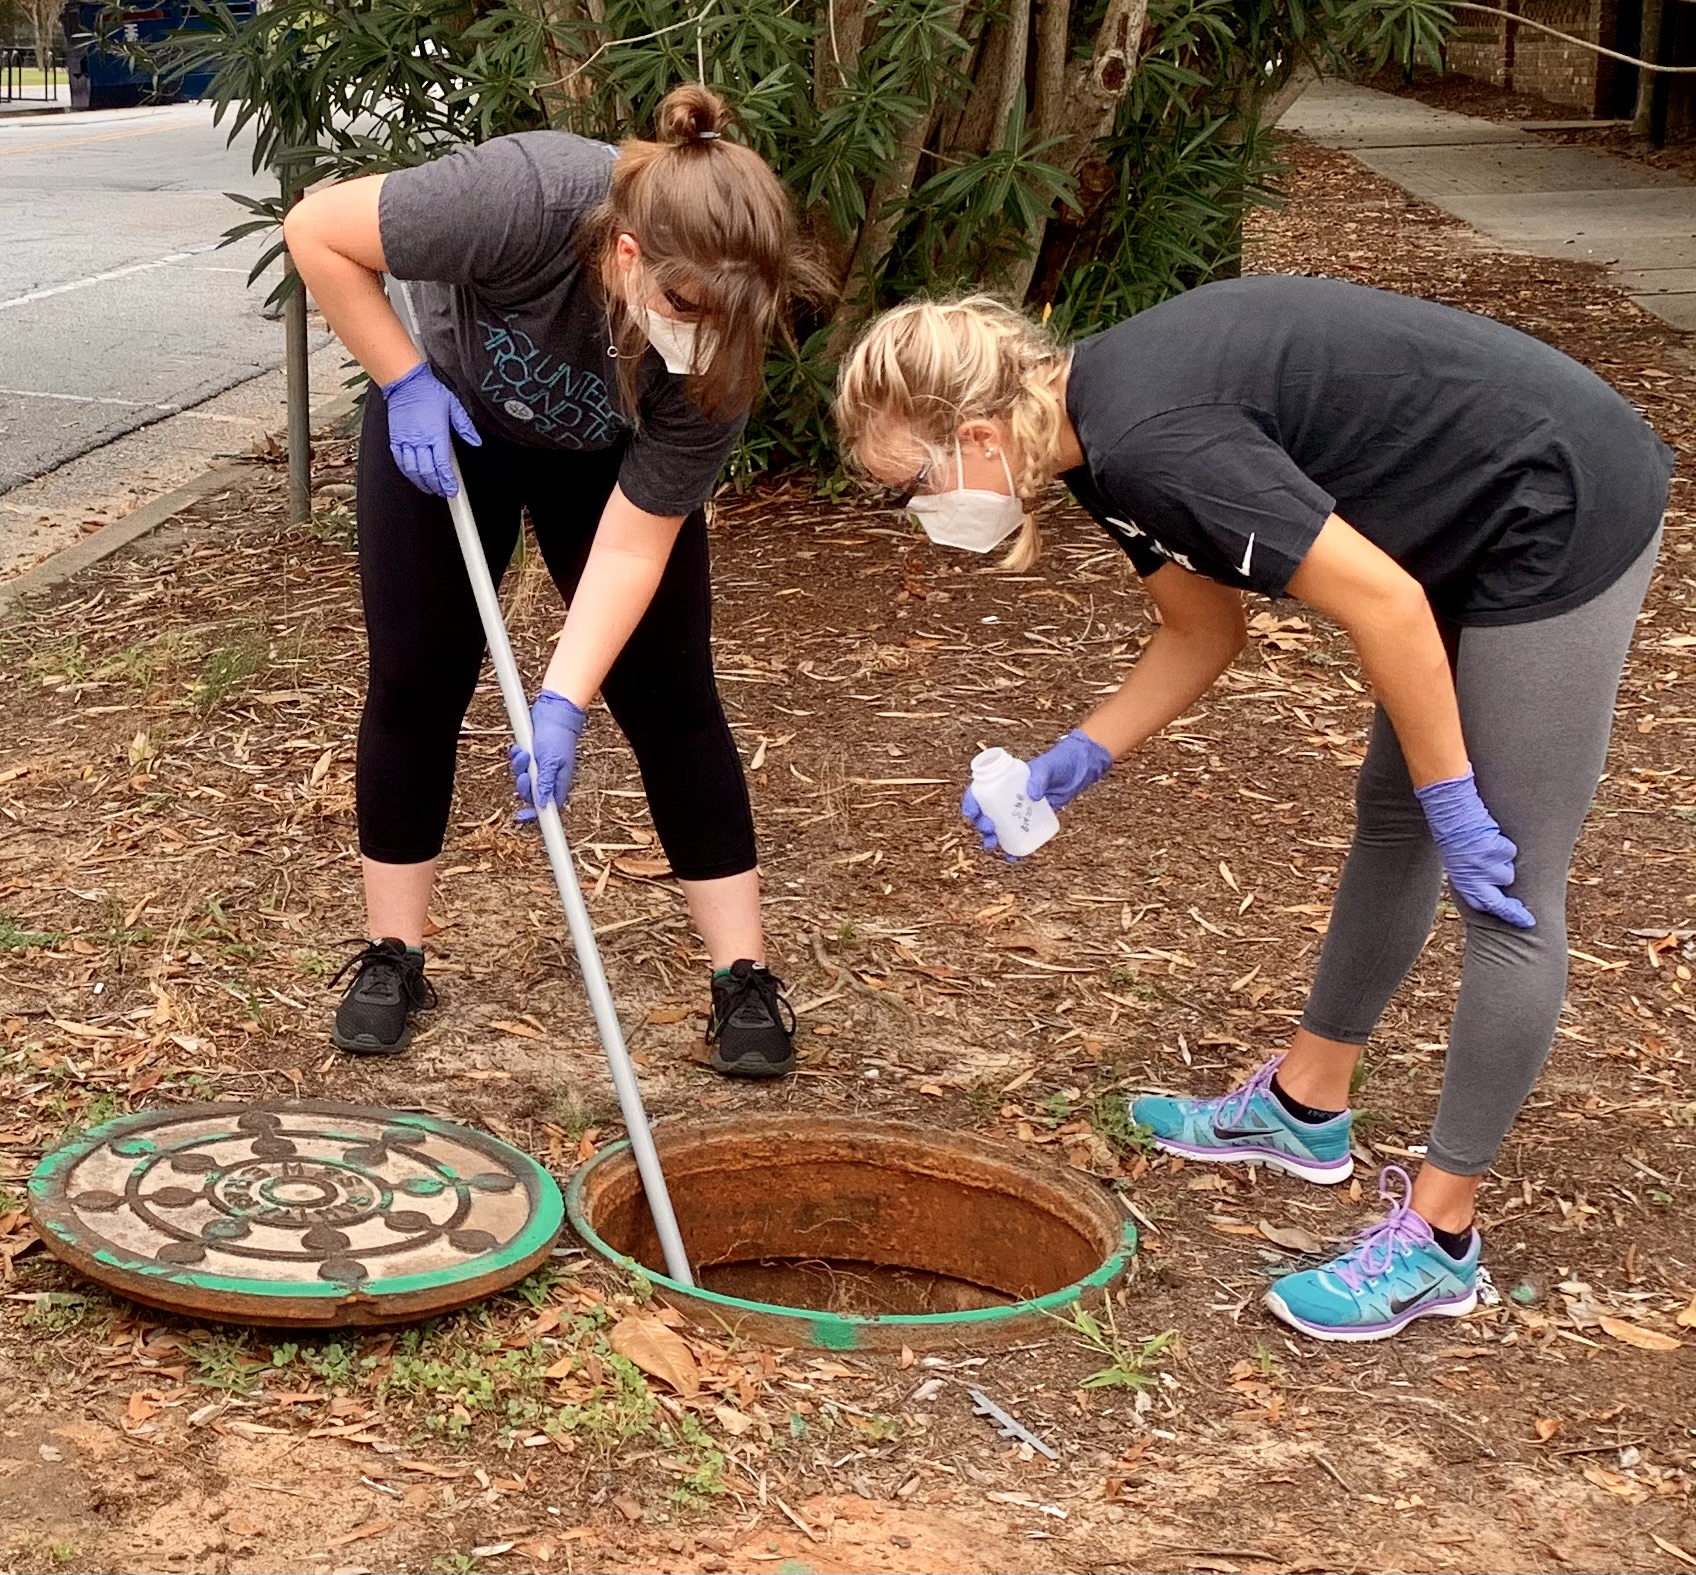
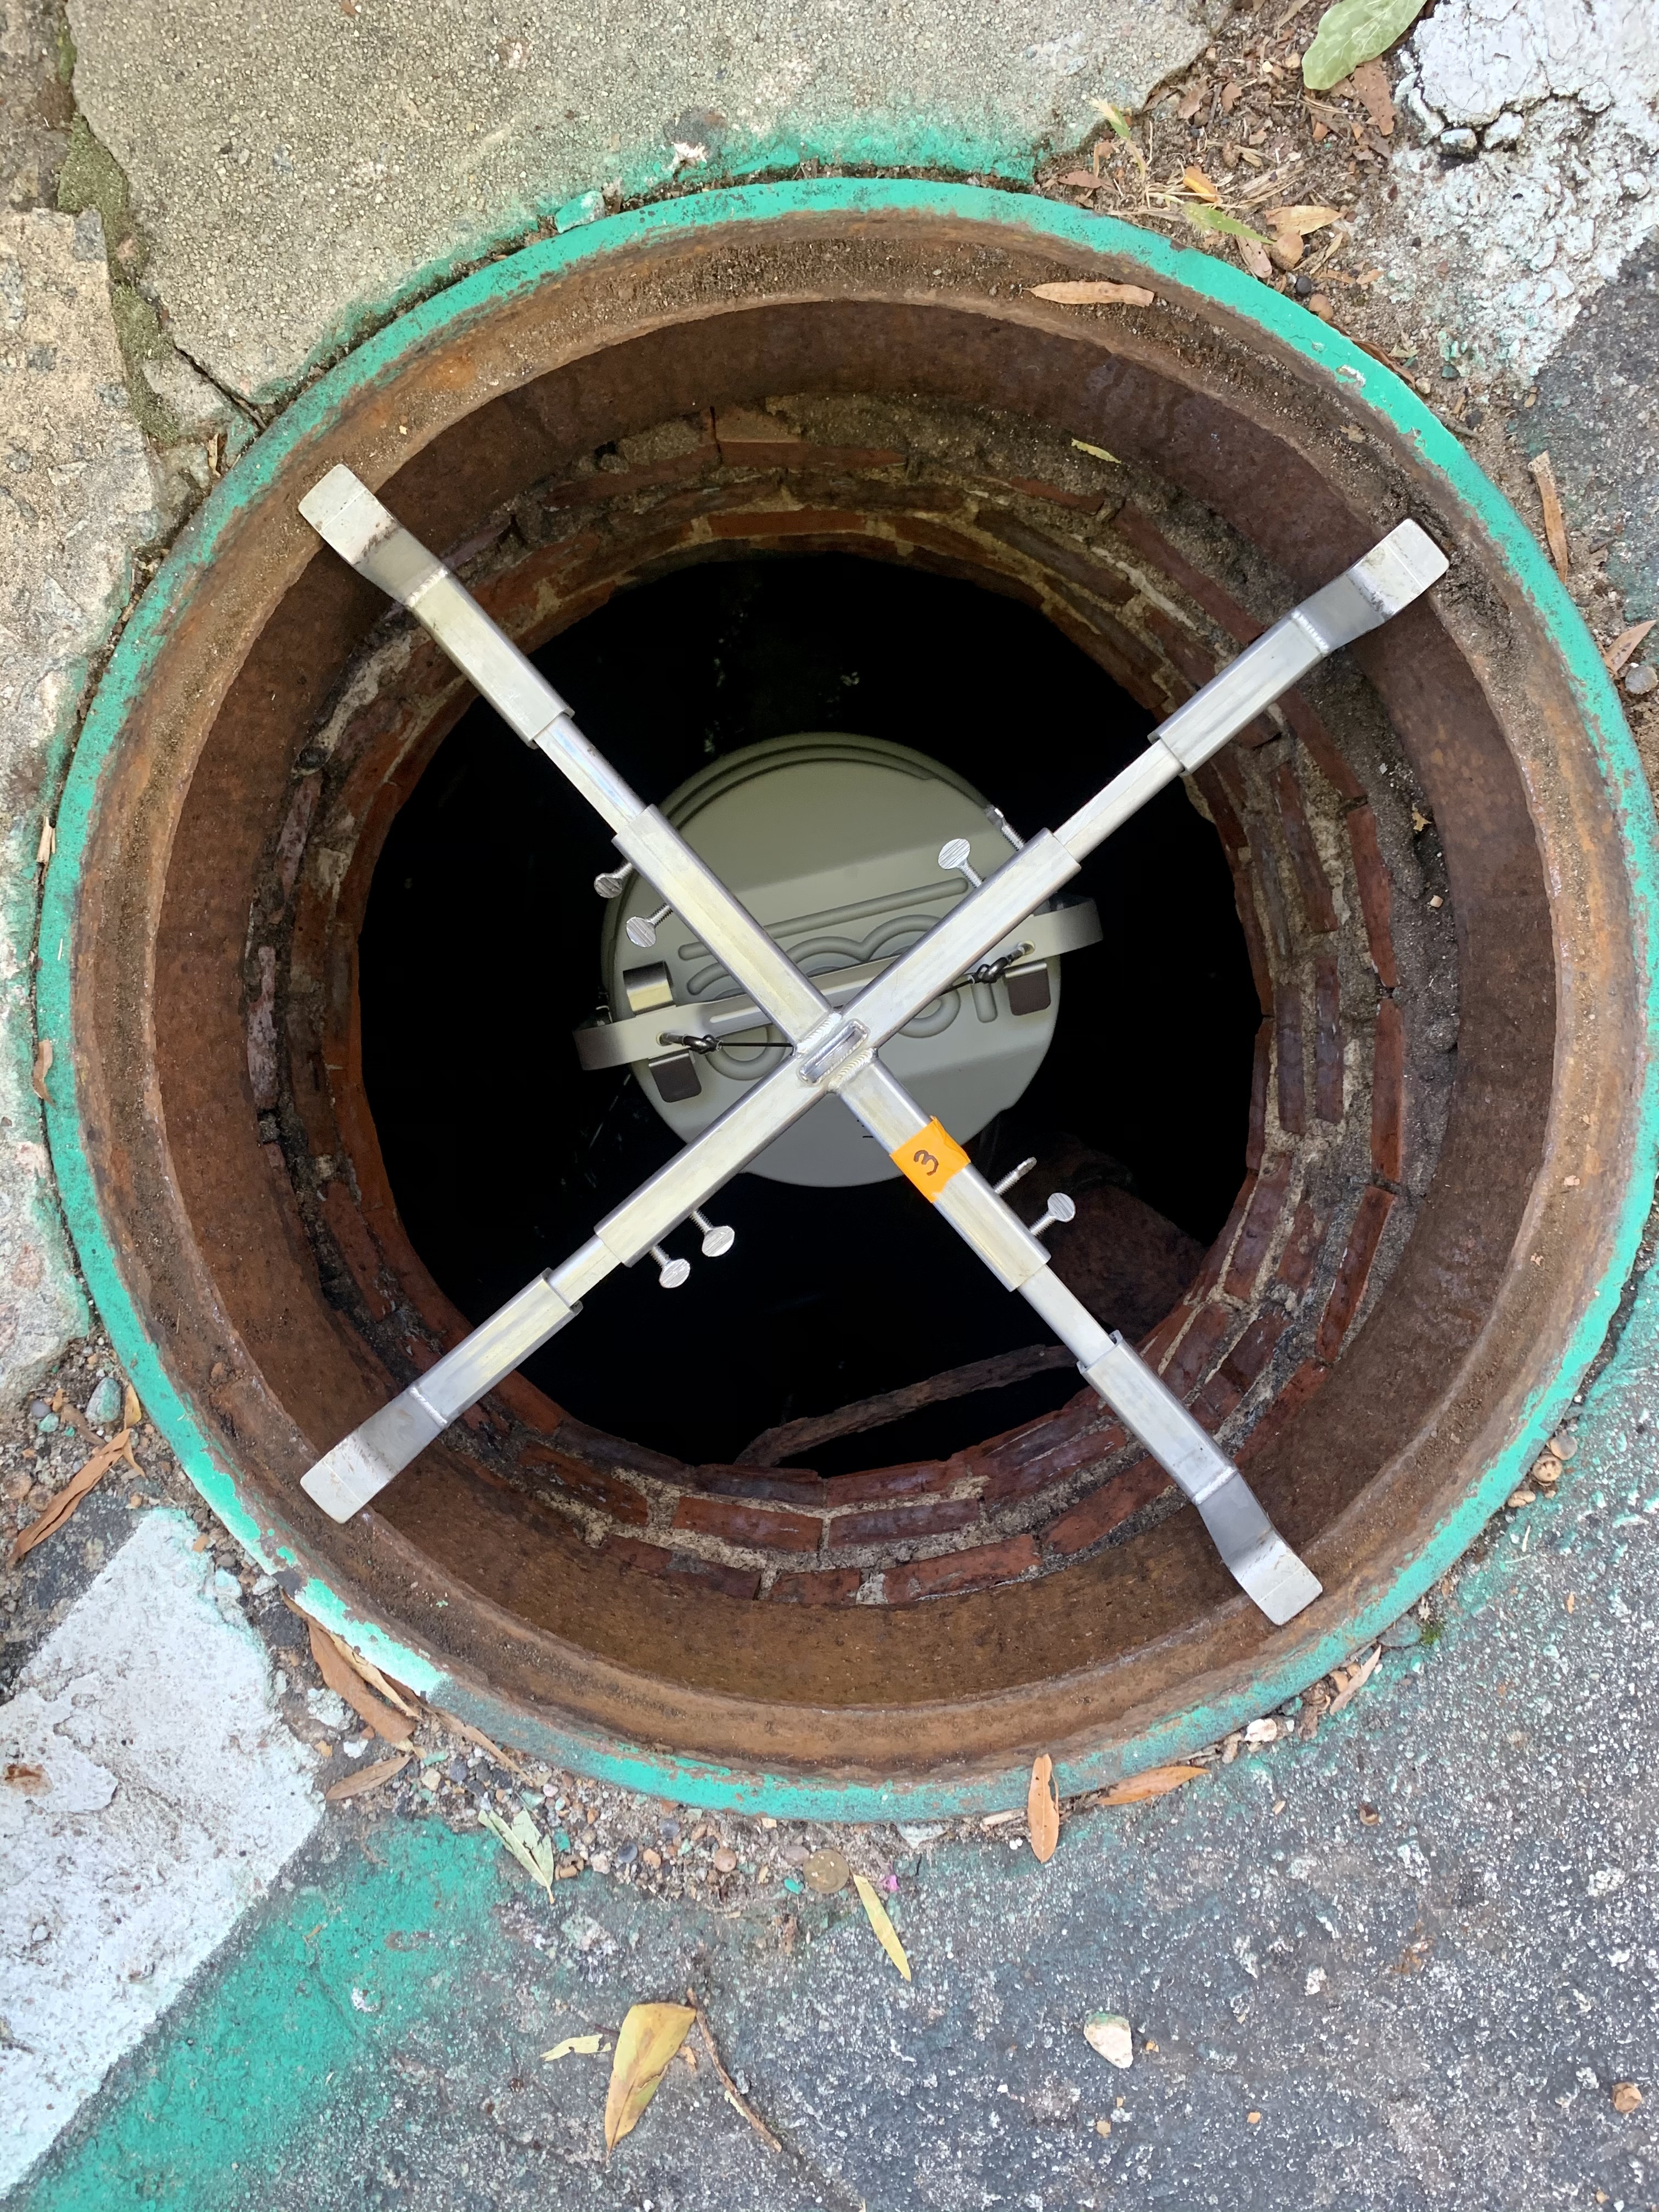
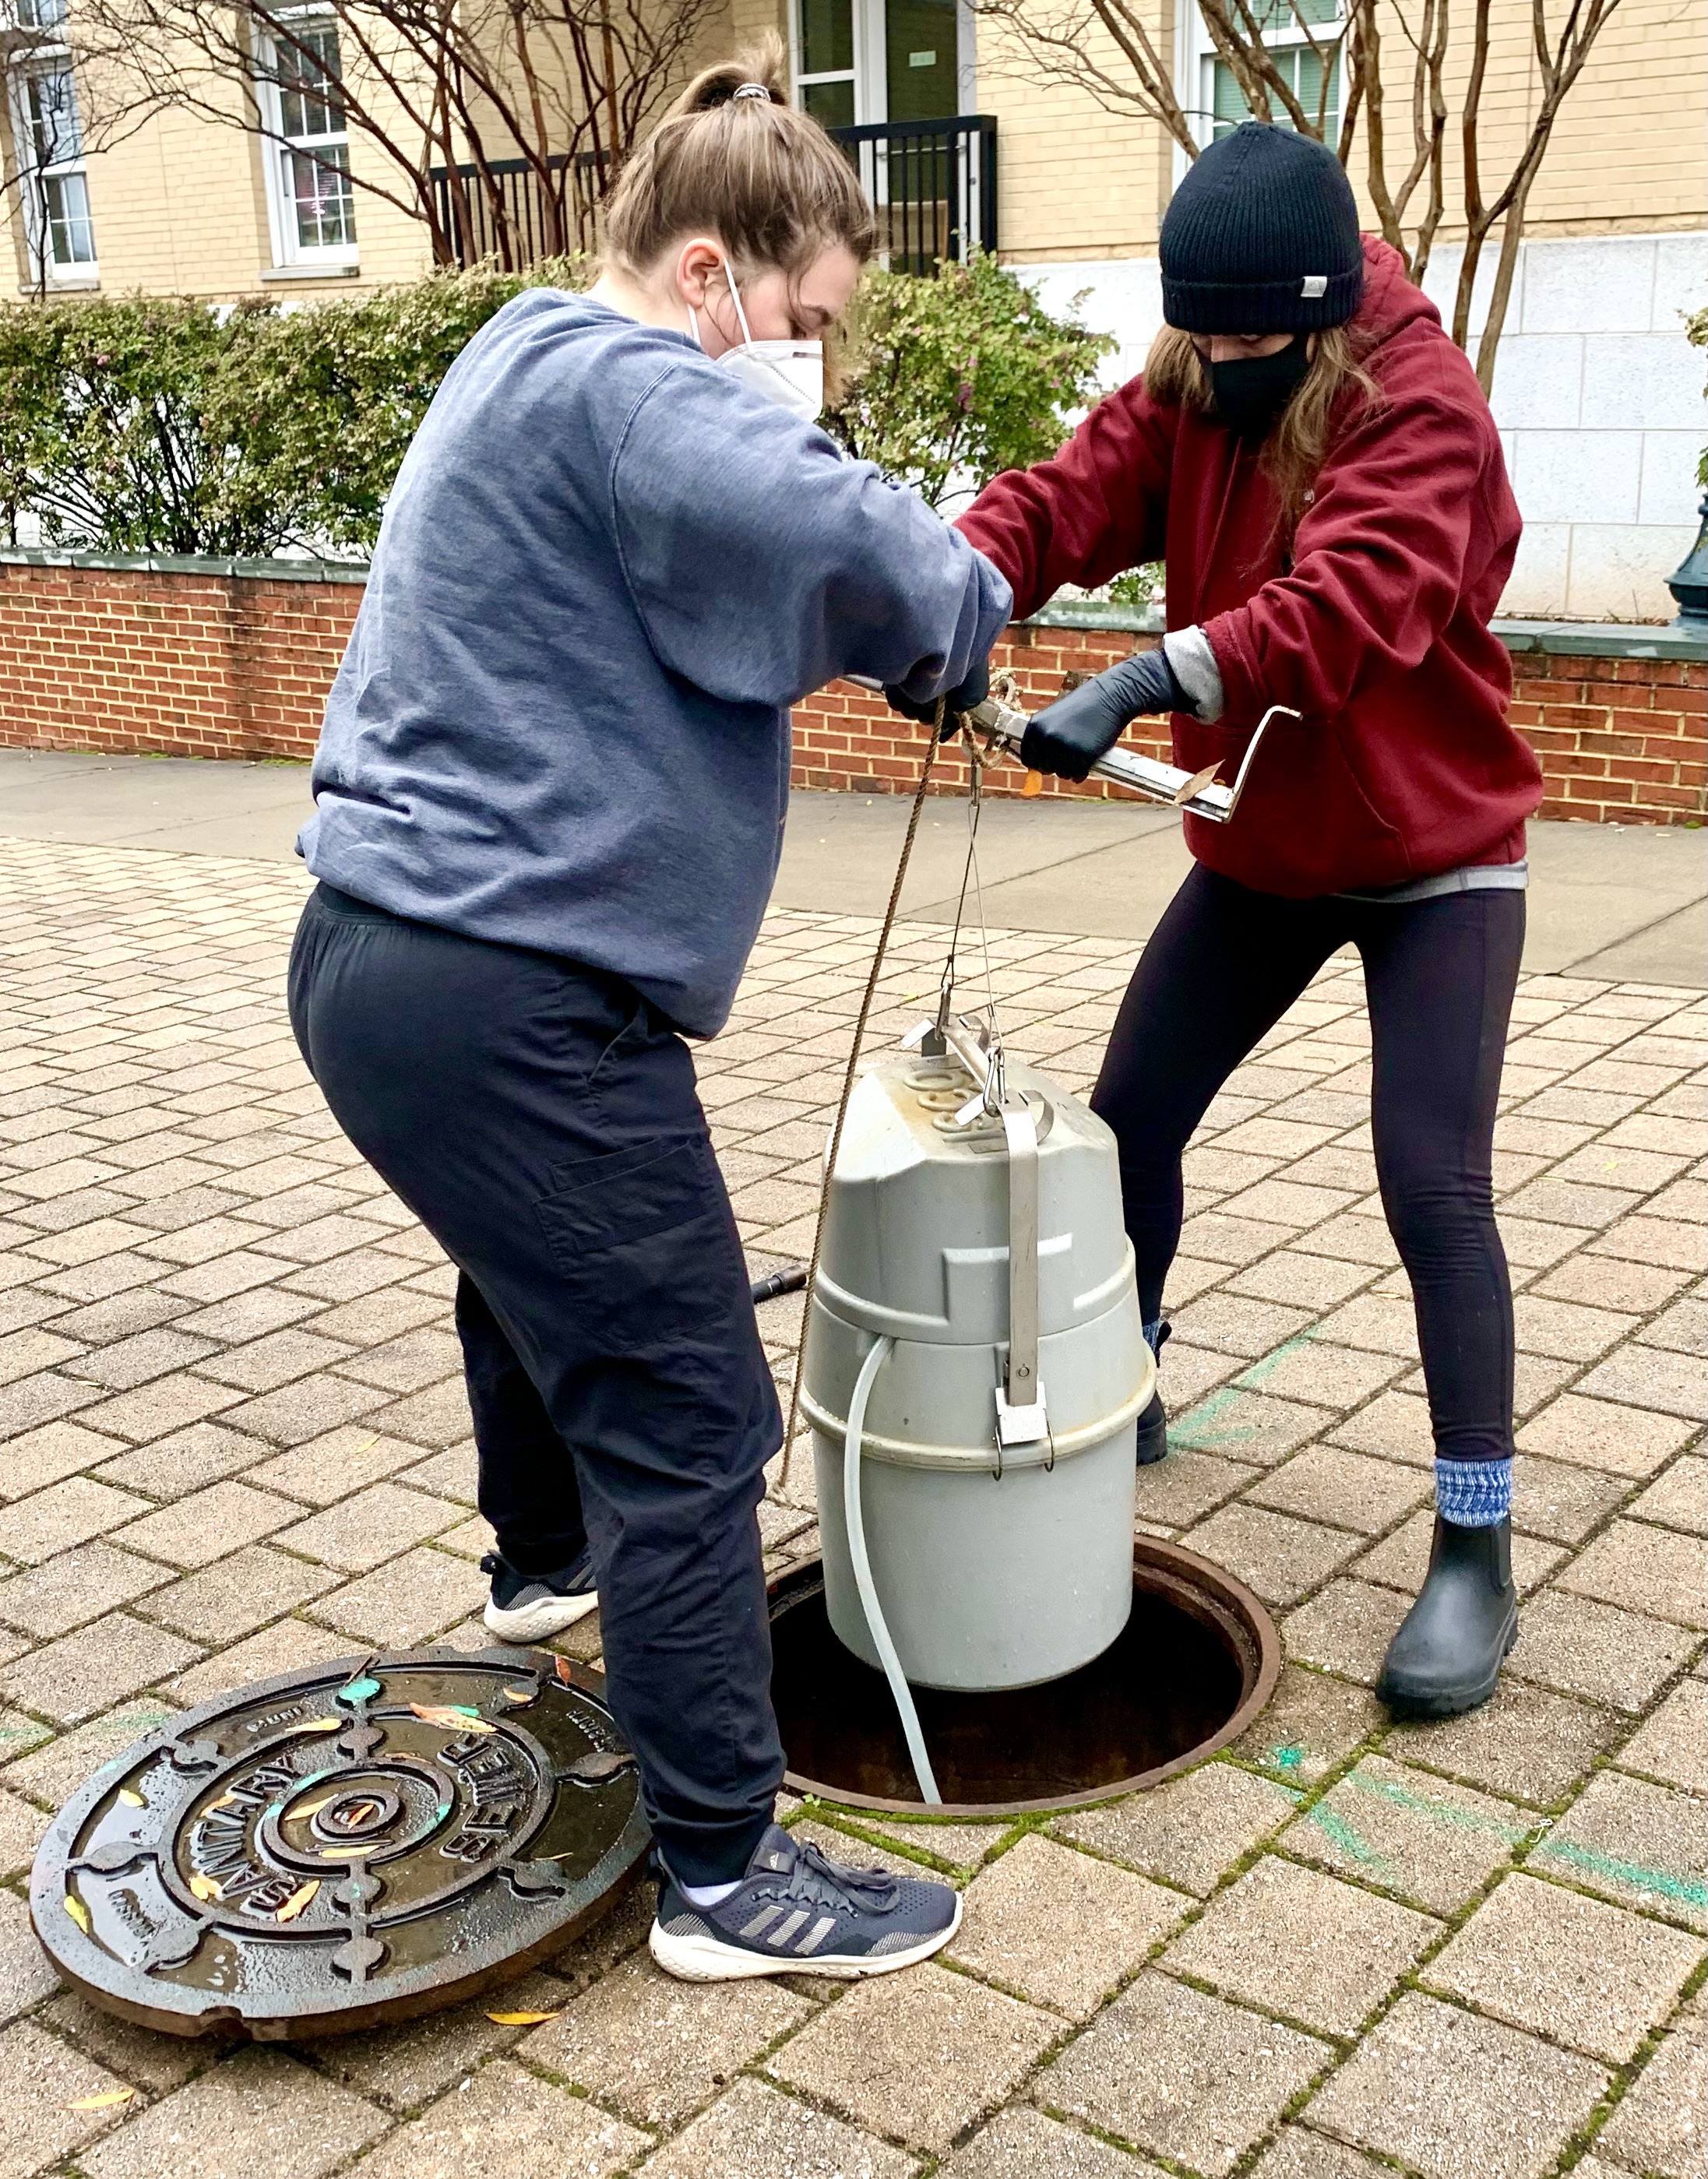
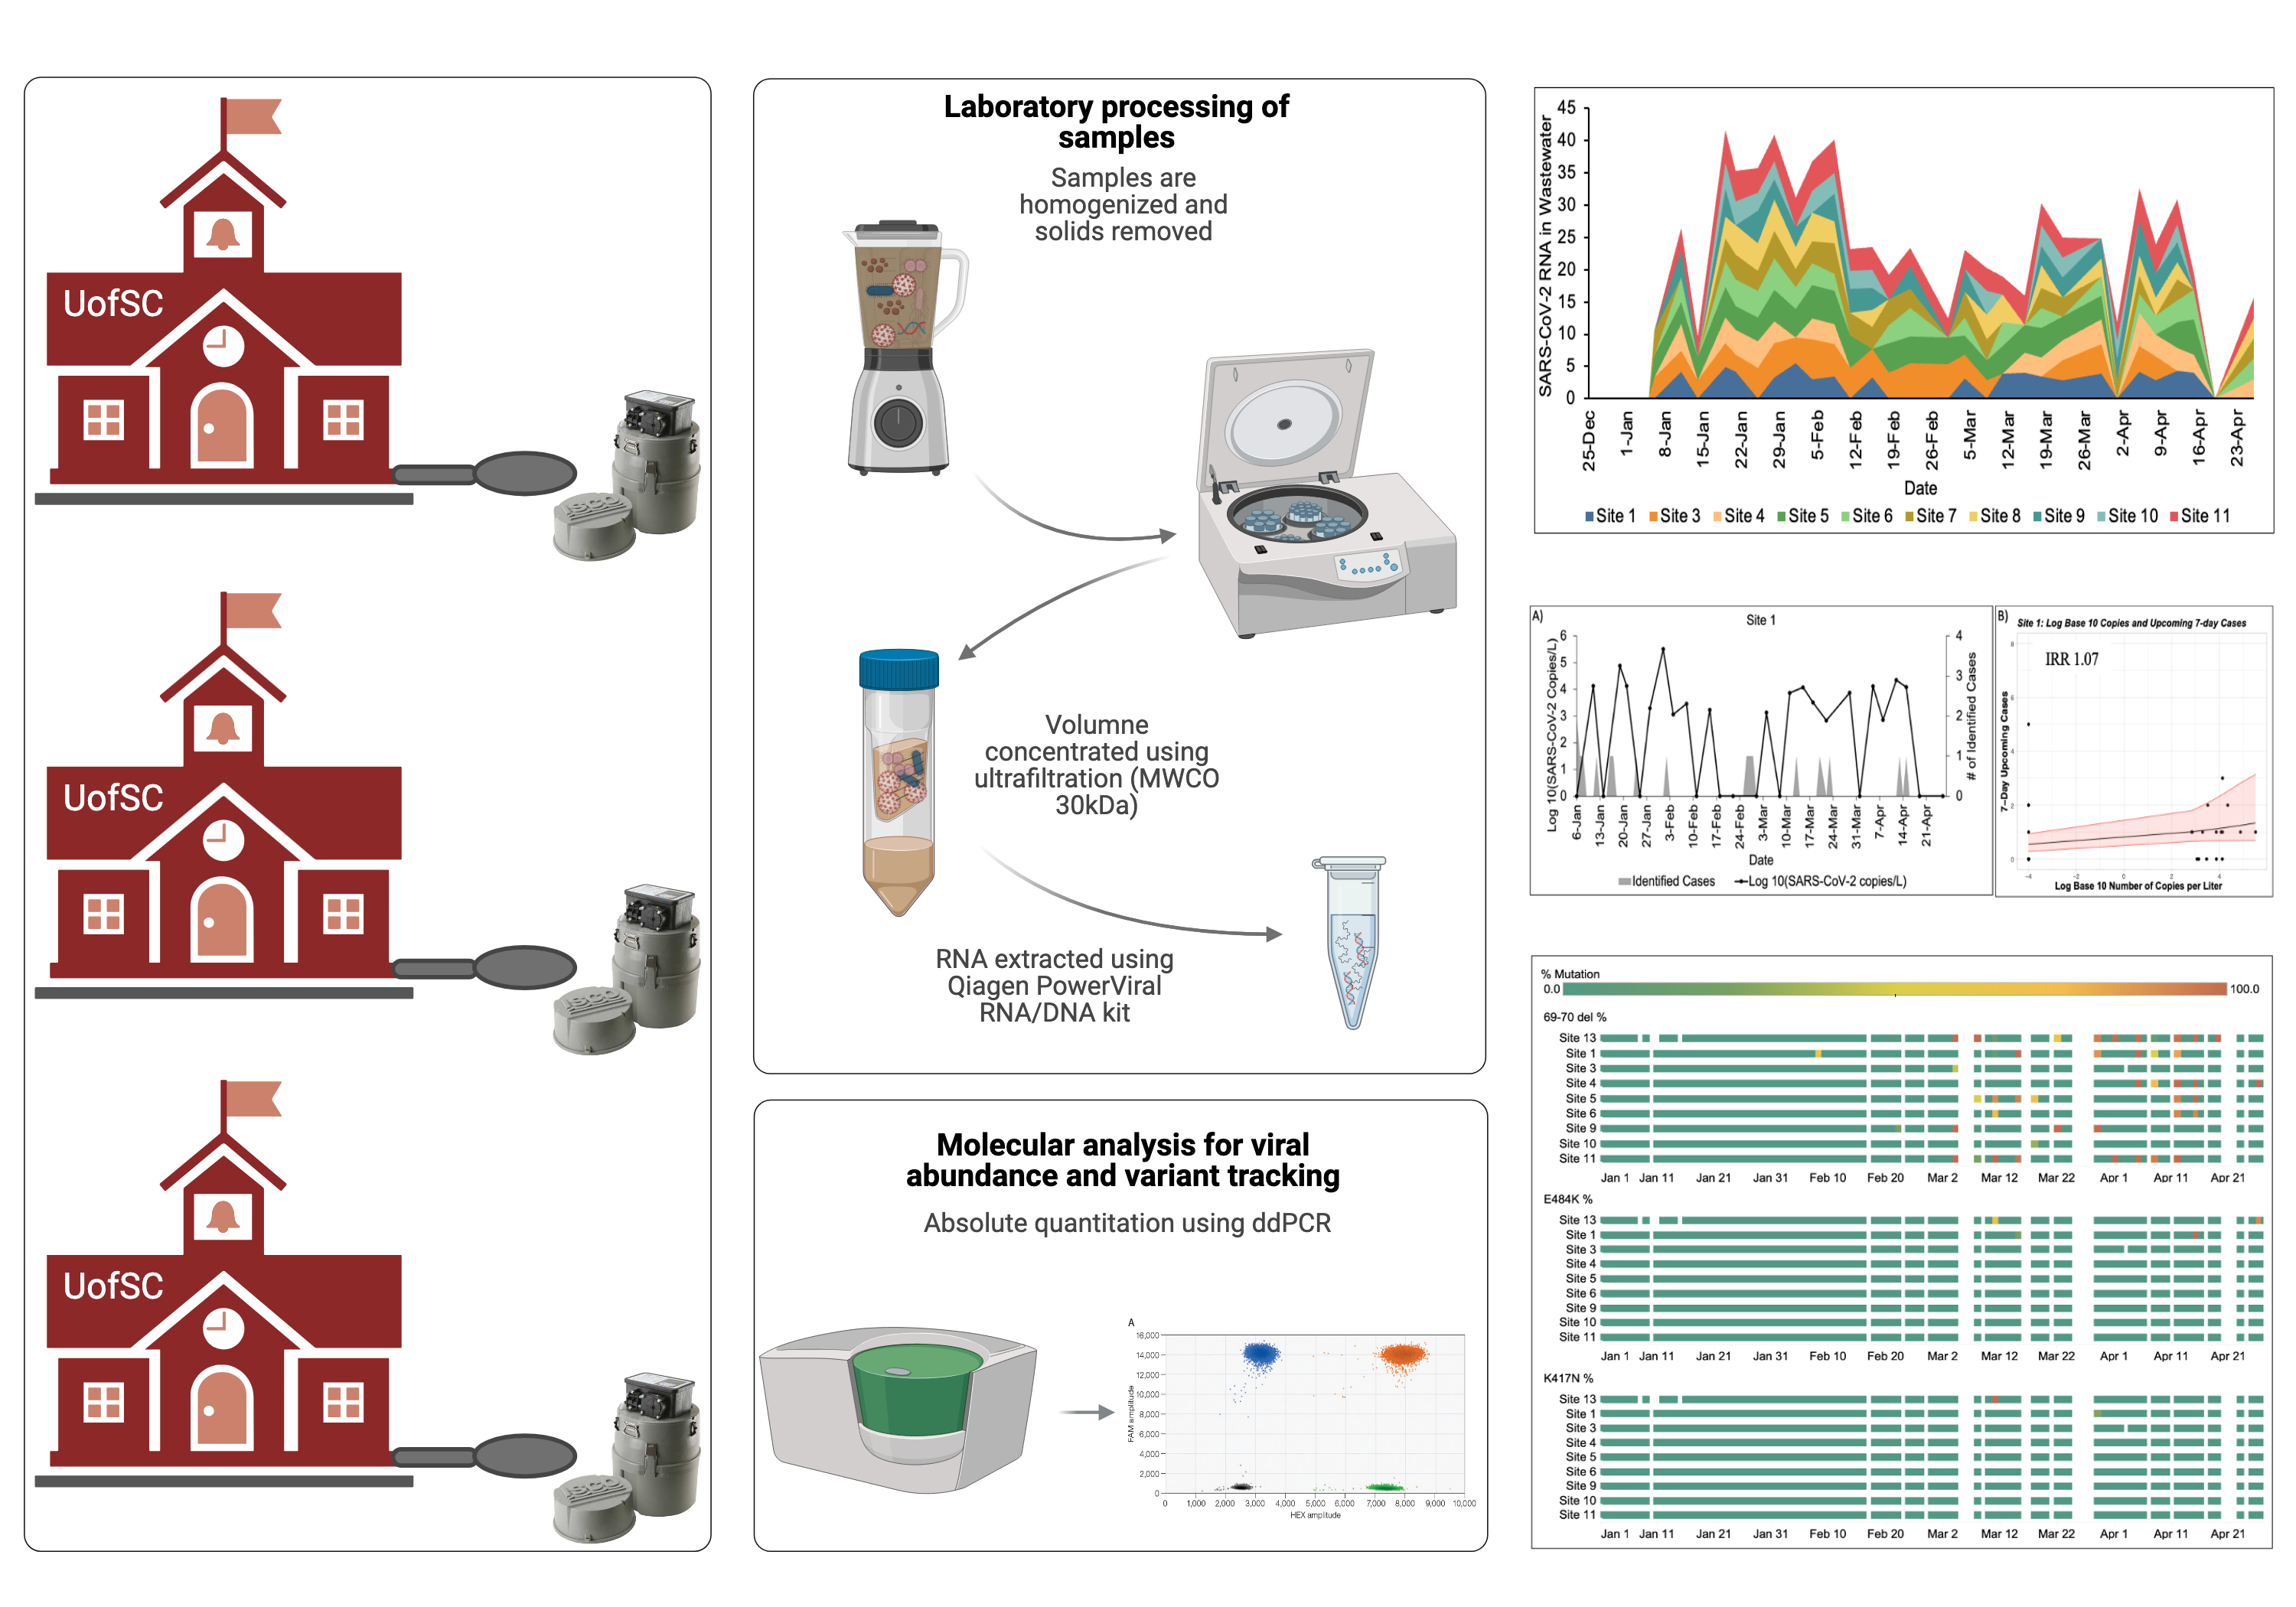
The University of South Carolina (UofSC) was among the first universities to include building-level wastewater surveillance of SARS-CoV-2 to complement clinical testing during its reopening in the Fall 2020 semester. In the Spring 2021 semester, 24h composite wastewater samples were collected twice per week from 10 residence halls and the on-campus student isolation and quarantine building. The isolation and quarantine building served as a positive control site. The wastewater was analyzed using RT-ddPCR for the quantification of nucleocapsid genes (N1 and N2) to identify viral transmission trends within residence halls. Log10 SARS-CoV-2 RNA concentrations were compared to both new clinical cases identified in the days following wastewater collection and recovered cases returning to sites during the days preceding sample collection to test temporal and spatial associations. There was a statistically significant positive relationship between the number of cases reported from the sites during the seven-day period following wastewater sampling and the log10 viral RNA copies/L (overall IRR 1.08 (1.02, 1.16) p-value 0.0126). Additionally, a statistically significant positive relationship was identified between the number of cases returning to the residence halls after completing isolation during the seven-day period preceding wastewater sampling and the log10 viral RNA copies/L (overall 1.09 (1.01, 1.17) p-value 0.0222). The statistical significance of both identified cases and recovered return cases on log10 viral RNA copies/L in wastewater indicates the importance of including both types of clinical data in wastewater-based epidemiology (WBE) research.
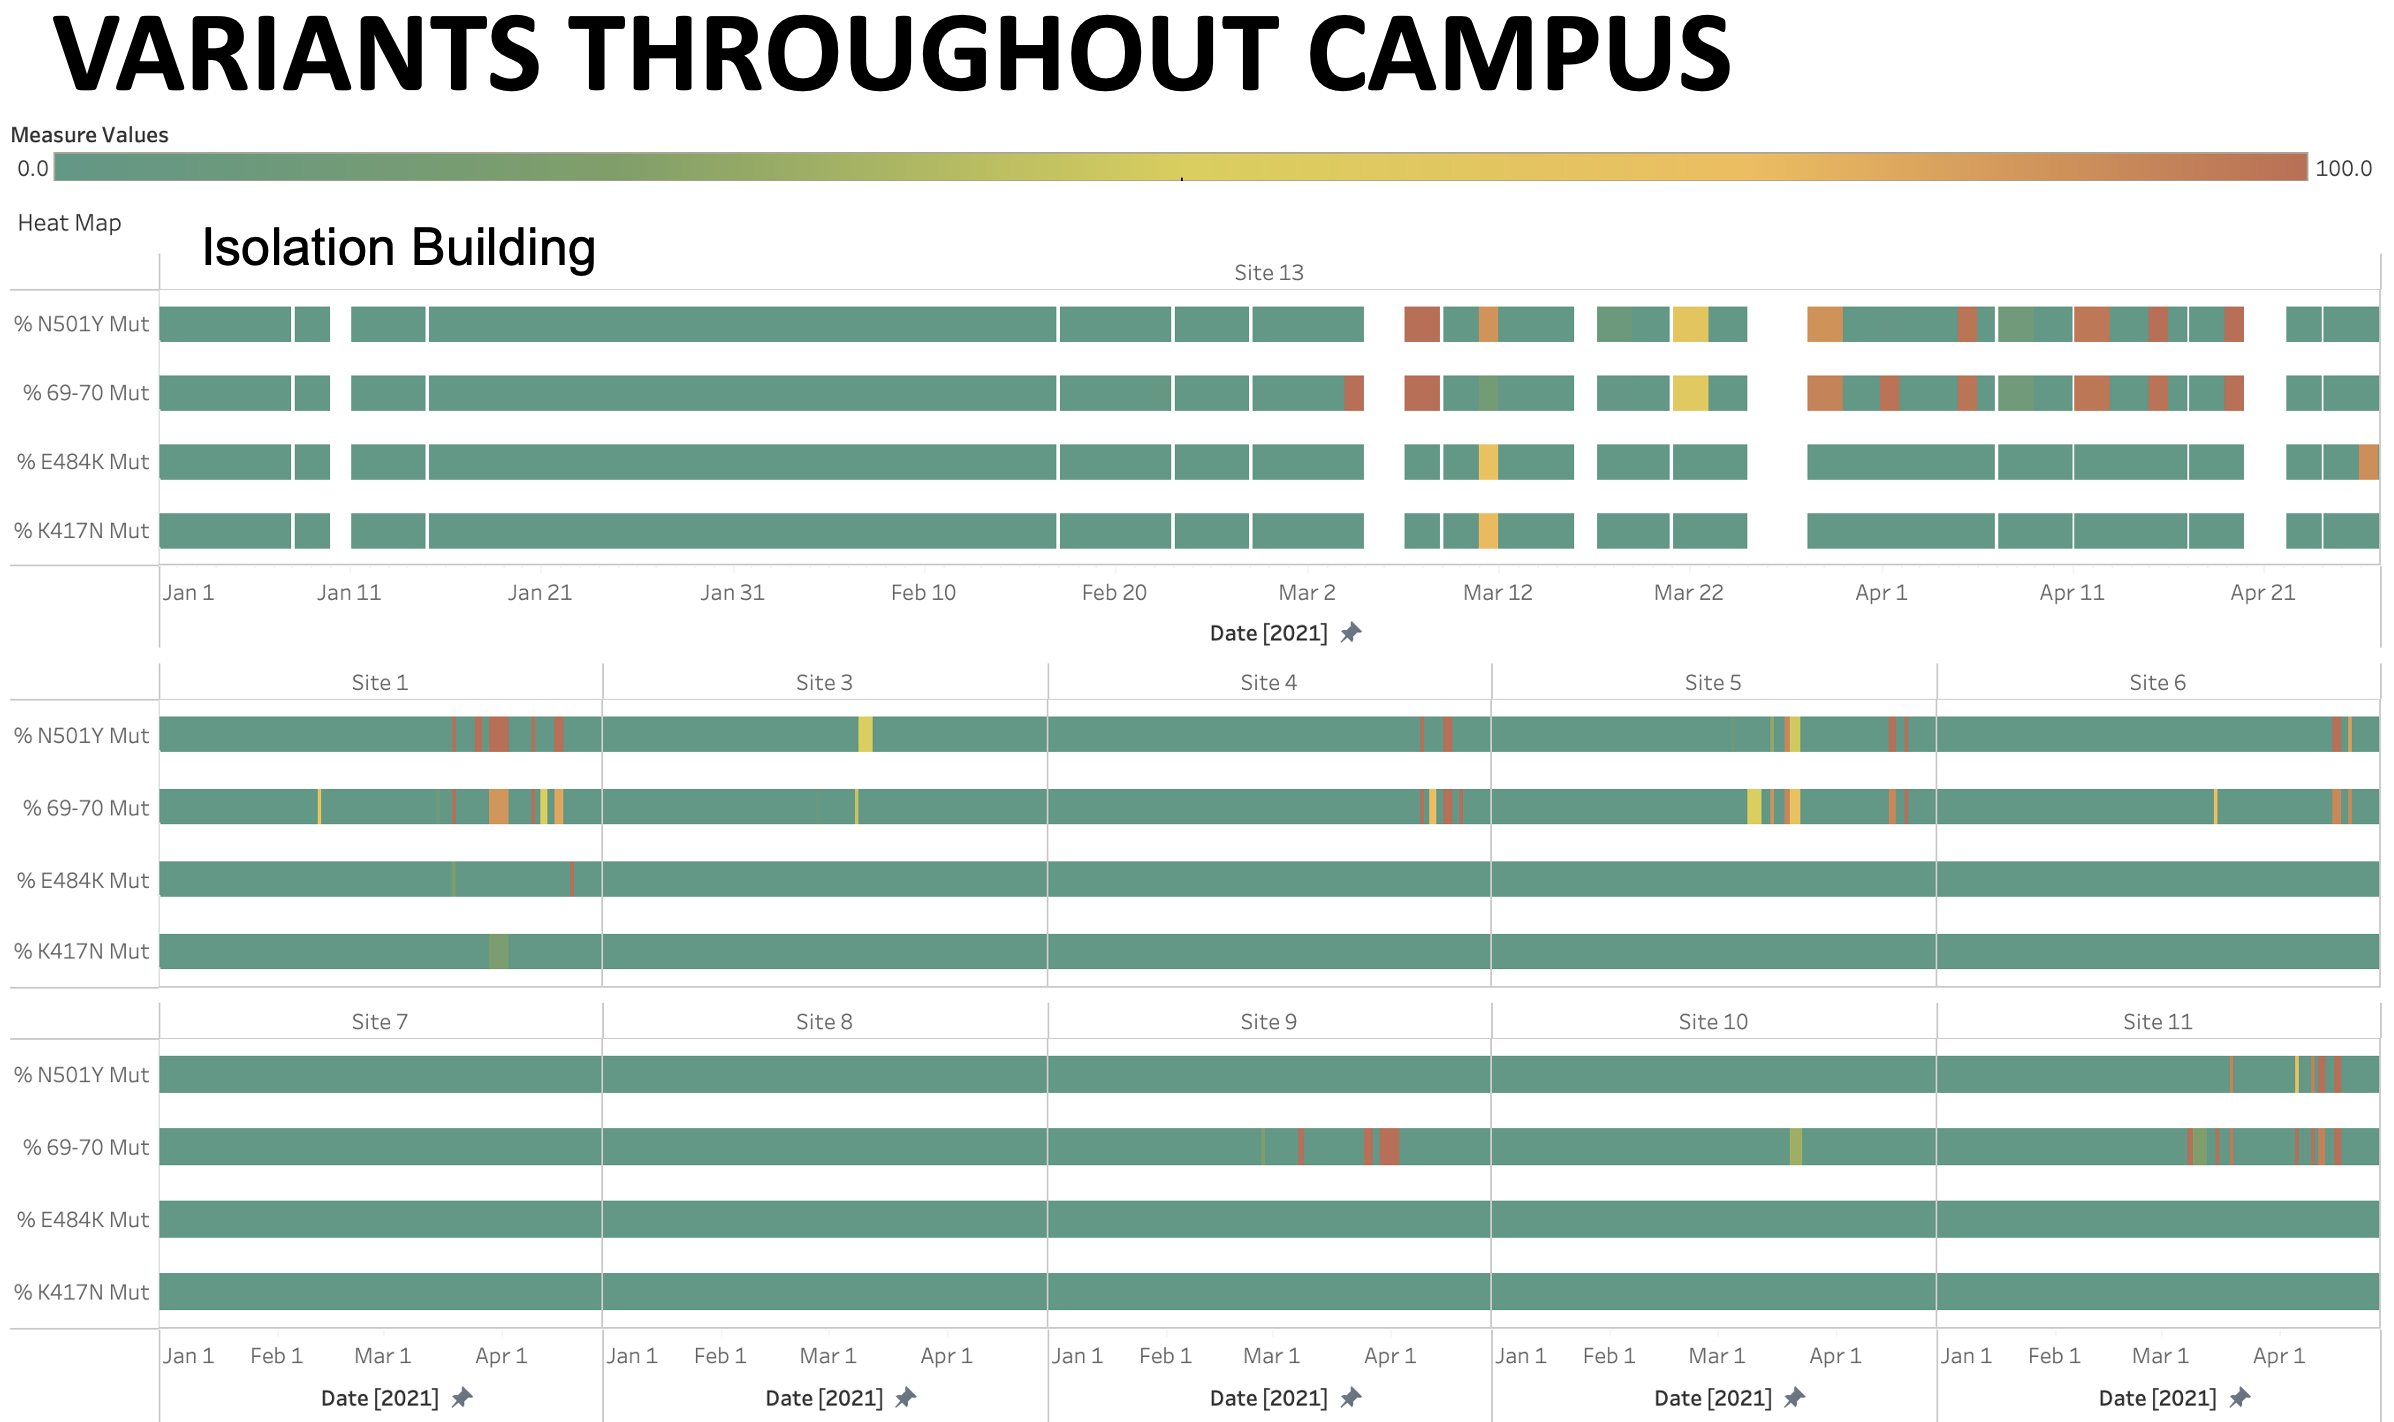
Monitoring the spread of SARS-CoV-2 VOCs across the USC campus
Alpha emergence detected in temporal and spatial variant analysis Wastewater samples were also monitored for the presence of the SARS-CoV-2 variants: Alpha (B.1.1.7), Beta (B.1.351), Delta (B1.617.2), and Gamma (P.1). Each variant mutation was detected in at least one site except for the Delta variant, which was not detected above the LOD. Site 13 contained confirmed positive students from each on-campus residence hall, including residence halls not participating in the study. The occupation by students from a wide range of residence halls at this site provided a broader perspective of transmission for the entire campus. It was estimated that VOCs started circulating on-campus during February after the initial occurrence of the 69–70 del mutation in wastewater collected at Site 1 on February 8 (66.67%) and Site 9 on February 22 (25.0%) (Fig. 5, Table S4). On March 4, the Alpha variant began to compose the majority (mean 62.49%) of the viral genotype in the wastewater samples from Site 13. In addition to Alpha, the Beta variant was observed in a single instance well above the LOD on March 11 but was not observed at any other time point in the isolation building. Spatial analysis of VOC occurrences across campus demonstrated that Sites 1, 3, 9, and 11 were the only residence halls to test positive for a variant of concern at the same time as the isolation building, indicating that these were among the first sites to experience VOC transmission on campus. Site 1 was the only residence hall to test positive for Alpha, Beta, and Gamma variants. However, the Beta and Gamma variants were only detected in a small number of samples, while the Alpha variant was the most frequently detected variant. VOCs were not detected in Sites 7 and 8 throughout the semester.
Video: The spatial and tempoaral trends of SARS-CoV-2 abundace across the USC campus
This video demonstrates the dynamic nature of viral transmission across the USC campus. The dots that appear and dissappear represent the viral abundance at different residence halls across campus. The dot size is representative of abundance where bigger dots equal higher viral abundance at that location and time.