Influence of temperature and pH on Vibrio vulnificus and Vibrio parahaemolyticus
This study aimed to better understand the potential effects of temperature and pH on V. vulnificus and V. parahaemolyticus planktonic and biofilm growth. Vibrio strains were grown in triplicate at 25°, 30°, and 37°C in 96 well plates containing Modified Seawater Yeast Extract modified with CaCl2 at pH's ranging from 5 to 9.6. AMiGA software was used to model growth curves using Gaussian process regression. The effects of temperature and pH were evaluated using randomized complete block analysis of variance, and the growth rates of V. parahaemolyticus and V. vulnificus were modeled using the interpolation fit on the MatLab Curve Fitting Toolbox. Different optimal conditions involving temperature and pH were observed for planktonic and biofilm Vibrio growth within- and between-species. This study showed that temperature and pH factors significantly affect Vibrio planktonic growth rates and V. parahaemolyticus biofilm formation.
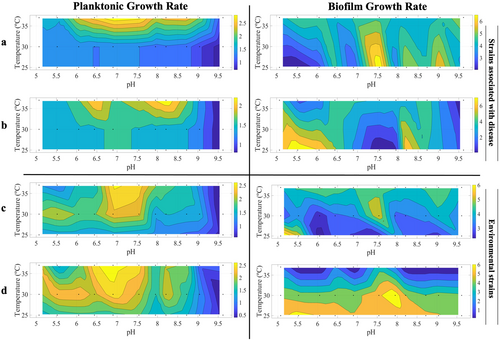
Influence of temperature and pH on Vibrio vulnificus growth
Modeling of bacterial growth rates in planktonic and biofilm stages of V. vulnificus strains at different temperatures and pH ranges. Strains associated with disease in humans and animals are shown in panels a (V. vulnificus NBRC 15645 = ATCC 27562) and b (V. vulnificus ATCC 33147). Environmental strains are shown in panels c (V. vulnificus NOAA 48) and d (V. vulnificus NOAA 155). Growth rates were calculated with yellow colors representing higher growth rates and blue representing lower growth rates.
Influence of temperature and pH on Vibrio parahaemolyticus growth
Modeling of bacterial growth rates in planktonic and biofilm stages of V. parahaemolyticus strains at different temperatures and pH ranges. Clinical reference strains are shown in panels a (V. parahaemolyticus ATCC 17802) and b (V. parahaemolyticus 48057). The environmental strains are shown in panels c (V. parahaemolyticus C12) and d (V. parahaemolyticus 4.1PR). Growth rates were calculated with yellow colors representing higher growth rates and blue representing lower growth rates.